
AI IN EXCEL
In this step-by-step tutorial, learn how to use Artificial Intelligence or A.I. in Microsoft Excel to easily and to quickly analyze your data.
Analyze Data in Excel enables you to ask questions about your data with natural language without having to write complicated formulas or code. It provides visual summaries, trends, and patterns for a great starting off point for you to dive into your data to understand insights. It provides great suggested questions or you can use it to ask your own questions.
ANALYZE DATA IN EXCEL WITH AI
- Open Microsoft Excel.
- Open the Sample Excel workbook to follow along with this example. Alternatively, you can use your own dataset.
- On the Ribbon, click the Home tab -> Analyze Data

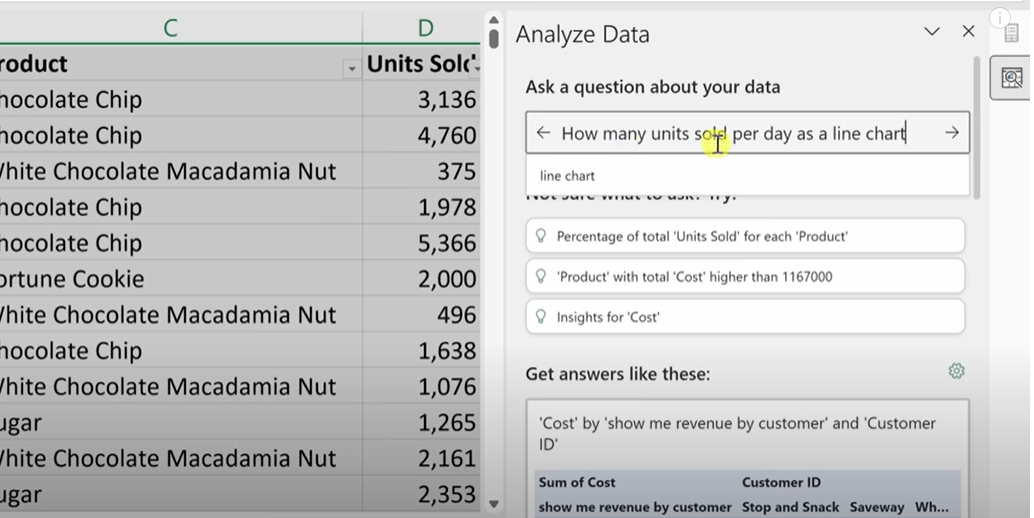
- This opens the Analyze Data pane where you can ask Excel your questions.

- Type in the question you have about the data set, for example, “How many units sold per day as a line chart”. Alternatively, you can use one of the pre-canned questions, like Percentage of total ‘Units Sold’ for each ‘Product‘.
- Press Enter.

- Excel generates a chart and PivotTable showing the answer to the question. Double-clicking on it will populate the chart and PivotTable in the Excel workbook.
- You can also ask Excel to come up with its own analysis by selecting Are there any date trends? Excel will then show you some interesting insights about the data. In the case with the worksheet provided, it will show outliners in the data.

- You can continue to refine your questions to have Excel build out interesting reporting and insights on your data.
RESOURCES
- Excel for Beginners Course – Go from Excel Novice to Data Analysis Ninja in just two hours!
- Sample Excel workbook to follow along

Hello Kevin,
I have been following you for the past four years.
Thank you so much for been my own knowledge vendor.
Quickly Mentor, Which version of Excel are you using that has the Analyse data tab under the Home.
Please help me to activate this AI tab to my Excel.
Regards.
LikeLike
Latest Office 365 subscription
LikeLike
If have the latest version (online and local MacOS) but when opening the data analyzer i can not ask any questions. There is no “Ask a question” field visible.
What is the missing key?
Thx
LikeLike